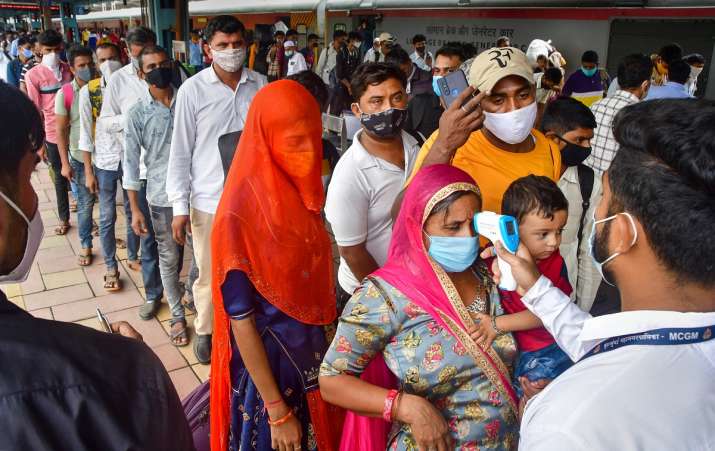
Mumbai: Commuters undergo thermal scanning following COVID-19 protocols at Dadar railway station
According to the Health Ministry, India recorded 44,643 fresh Covid-19 cases on Friday and also 464 deaths in the last 24 hours. The daily test positivity rate is 1.29 per cent. Data from the Union Health Ministry shows that with 44,643 cases, the country’s cumulative infections have approached 32 million. During the last 24 hours, 41,096 patients were cured.
India registered over 40,000 Covid cases for the third day in a row, amid concerns over an escalation in the trajectory of fresh infections. The total death toll in India rose to 426,754.
The active cases in the country have increased by over 700 in the last 24 hours. The total number of infectious disease cases in the country has now reached 31.8 million. At present the active caseload is 4,14,159, while a total of 3,10,15,844 patients have been cured.
Till August 5, a total of 47,65,33,650 samples were tested. The Indian Council of Medical Research (ICMR) said that out of these 16,40,287 samples were tested yesterday.
India has so far administered 49.53 crore COVID-19 doses, data released by the Health Ministry showed.
India Coronavirus State Wise Tally:
| serial number | State/Union Territory Name | Active Case* | OK/Discharge/Migrate* | Deaths** | |||
|---|---|---|---|---|---|---|---|
| complete | change from yesterday | cumulative | change from yesterday | cumulative | change from yesterday | ||
| 1 | Andaman and Nicobar Islands | 4 | 2 | 7408 | 3 | 129 | |
| 2 | Andra Pradesh | 20184 | 14 | 1940368 | 2412 | 13444 | 16 |
| 3 | Arunachal Pradesh | 3337 | 15 | 45630 | 332 | 236 | 2 |
| 4 | Assam | 12223 | 217 | 552955 | 1263 | 5326 | 19 |
| 5 | A state in Eastern India | 366 | 18 | 715011 | 62 | 9646 | 2 |
| 6 | Chandigarh | 31 | 3 | 61123 | 3 | 811 | |
| 7 | Chattisgarh | 1906 | 25 | 987298 | 109 | 13531 | 1 |
| 8 | Dadra and Nagar Haveli and Daman and Diu | 15 | 1 | 10633 | 4 | ||
| 9 | Delhi | 513 | 6 | 1410947 | 73 | 25058 | |
| 10 | Goa | 1018 | 19 | 167335 | 90 | 3153 | 1 |
| 1 1 | Gujarat | 213 | 13 | 814665 | 28 | 10076 | |
| 12 | Haryana | 712 | 4 | 759653 | 20 | 9644 | 3 |
| 13 | Himachal Pradesh | 1508 | 94 | 201797 | 145 | 3527 | 4 |
| 14 | Jammu and Kashmir | 1314 | 21 | 316315 | 127 | 4385 | 1 |
| 15 | Jharkhand | 223 | 1 1 | 341924 | 41 | 5129 | |
| 16 | Karnataka | 24330 | 25 | 2850717 | 1714 | 36680 | 30 |
| 17 | Kerala | 176564 | 2828 | 3277788 | 1947 | 17211 | 108 |
| 18 | Ladakh | 67 | 4 | 20091 | 4 | 207 | |
| 19 | Lakshadweep | 81 | 9 | 10100 | 14 | 50 | |
| 20 | Madhya Pradesh | 155 | 16 | 781240 | 12 | 10513 | |
| 21 | Maharashtra | 76224 | 1505 | 6117560 | 7436 | 133410 | 195 |
| 22 | Manipur | 9015 | 475 | 90769 | 1226 | 1606 | 14 |
| 23 | Meghalaya | 5516 | 58 | 60375 | 572 | 1125 | 7 |
| 24 | Mizoram | 13065 | 402 | 28861 | 684 | 157 | 1 |
| 25 | Nagaland | 1321 | 60 | 26317 | 83 | 579 | 2 |
| 26 | Orissa | 12295 | 381 | 963718 | 1630 | 6168 | 66 |
| 27 | Puducherry | 907 | 22 | 118547 | 95 | 1798 | 3 |
| 28 | Punjab | 473 | 10 | 582494 | 52 | 16299 | |
| 29 | Rajasthan Rajasthan | 211 | 9 | 94456 | 27 | 8954 | |
| 30 | Sikkim | 3404 | 3 | 23589 | 213 | 349 | 1 |
| 31 | Tamil Nadu | 2017 | 100 | 2513087 | 2011 | 34197 | 38 |
| 32 | Telangana | 8803 | 26 | 634612 | 594 | 3814 | 3 |
| 33 | Tripura | 2954 | 8 | 75817 | 248 | 761 | 4 |
| 34 | Uttarakhand | 576 | 5 | 334341 | 42 | 7366 | |
| 35 | Uttar Pradesh | 686 | 14 | 1685170 | 45 | 22767 | 2 |
| 36 | West Bengal | 10745 | 22 | 1501925 | 838 | 18180 | 10 |
| complete# | 411076 | 723 | 30974748 | 41726 | 426290 | 533 | |
| *(including foreign nationals) | |||||||
| **(more than 70% of cases due to comorbidities) | |||||||
| #State wise distribution is subject to further verification and reconciliation | |||||||
| #Our data is being matched with ICMR | |||||||
Read also: Rajasthan going through complex economic situation due to Kovid, other reasons: Gehlot
Read also: Third wave of COVID could drag GDP growth to 7%: Economist Abhijit Banerjee
.